How To Use Ecommerce Returns Data To Segment Customers For More Profit
The Importance of Intelligent Customer Segmentation in Your Ecommerce Marketing Strategy
Ecommerce Managers and marketers are well aware that not all customers are created equal and customer segmentation is vital for long term success online. Contacting and targeting customers based on their needs, interests, or any patterns of activity is a must.
Table of Contents:
- Why Returns Management Data is the Rosetta Stone of Your Smart Ecommerce Marketing Strategy
- Utilizing RFM Analysis to Target the Right Customer with the Right Message at the Right Time
- Identifying Your Key Customer Clusters and Moving Them Along the Buyer’s Journey
- How RFM Analysis and Behavior Segmentation Can Pour Jet Fuel on Your E-commerce Marketing Strategy
- How to Use Returns Data to Spot High-Performing Customers Early
- Turning Returns Management Insight into an Actionable E-commerce Marketing Strategy (4 Tests You Can Run Today!)
- How You Can Implement This for Your E-commerce Store
While no two consumers are exactly the same, segmentation leads to smarter, more tailored touch points while maintaining efficiency of scale. This allows you to create a personalized experience for each customer, much like Amazon and Netflix.
The hard part, however, is identifying relevant criteria on which to segment customers, which will lead to actionable insights.
If you end up segmenting on the wrong data points, you can end up wasting a lot of time and risk losing a whole lot of money in the process.
And for this reason, we humble data nerds on the ReturnLogic Data & Analytics team use RFM Analysis to cluster customer segmentation. This is a framework that conceptualizes consumer purchase patterns as Recency, Frequency, and Monetary elements.
For our purposes:
- Recency = number of days since the most recent purchase for a customer.
- Frequency = average number of days between purchases for a customer.
- Monetary = total spend for a customer, less the value of their returns.
These metrics allow us to numerically reflect the purchase activity of customers, and find patterns that may inform customer segmentation.
Why Returns Management Data is the Rosetta Stone of Your Smart Ecommerce Marketing Strategy
Ecommerce personalization and customer segmentation starts with data collection. By including returns data into the equation, you are able to capture the true value of each customer transaction. Analyzing price paid alone can lead to a false assumption of profit.
With the continued increase in customer acquisition costs on social & traditional channels and few new channels emerging, it is more important than ever to have a clear view on your bottomline.
This is why we feel strongly that returns management data is essential to truly understand monetary calculations in RFM analysis.
The average return rate for a fashion retailer is 30%. That means that you’re only taking home 70% of the revenue typically calculated in price paid analysis.
Utilizing RFM Analysis to Target the Right Person with the Right Message at the Right Time
Through RFM Analysis, the team was able to characterize and quantify consumer purchase behaviors. There is a lot of great work out there on how ecommerce managers and marketers can use RFM to drive their ecommerce personalization strategy.
Kunle Campbell from 2XE-commerce.com and host of the 2x Ecommerce podcast says:
“Marketers use the RFM model to filter out and score each customer by their most recent purchase by date (which is the ‘recency’ segment), by each customer’s number of orders (their purchase frequency) and then by their cumulative order value over a specified period of time (for the monetary analysis piece).”
This approach is intriguing and a step in the right direction, but we wanted to take the customer segmentation one step further.
To power this we added these parameters into a K-means cluster analysis. The goal here is to identify clusters of customers, or groups whose members behave similarly.
K-means clustering allows us to dynamically drill down and find groups of customers who behave in similar ways. Each cluster is different and requires different approaches with different calls to action. (We’ll dig into this more later in the post and share some examples of possible engagement campaigns for a few clusters.)
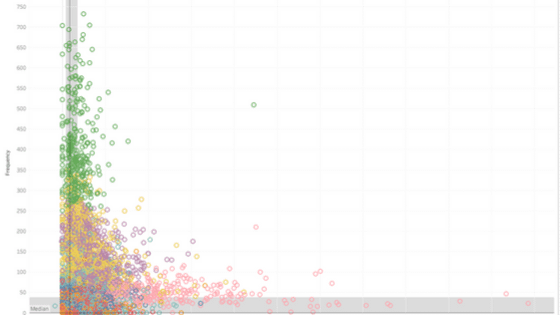
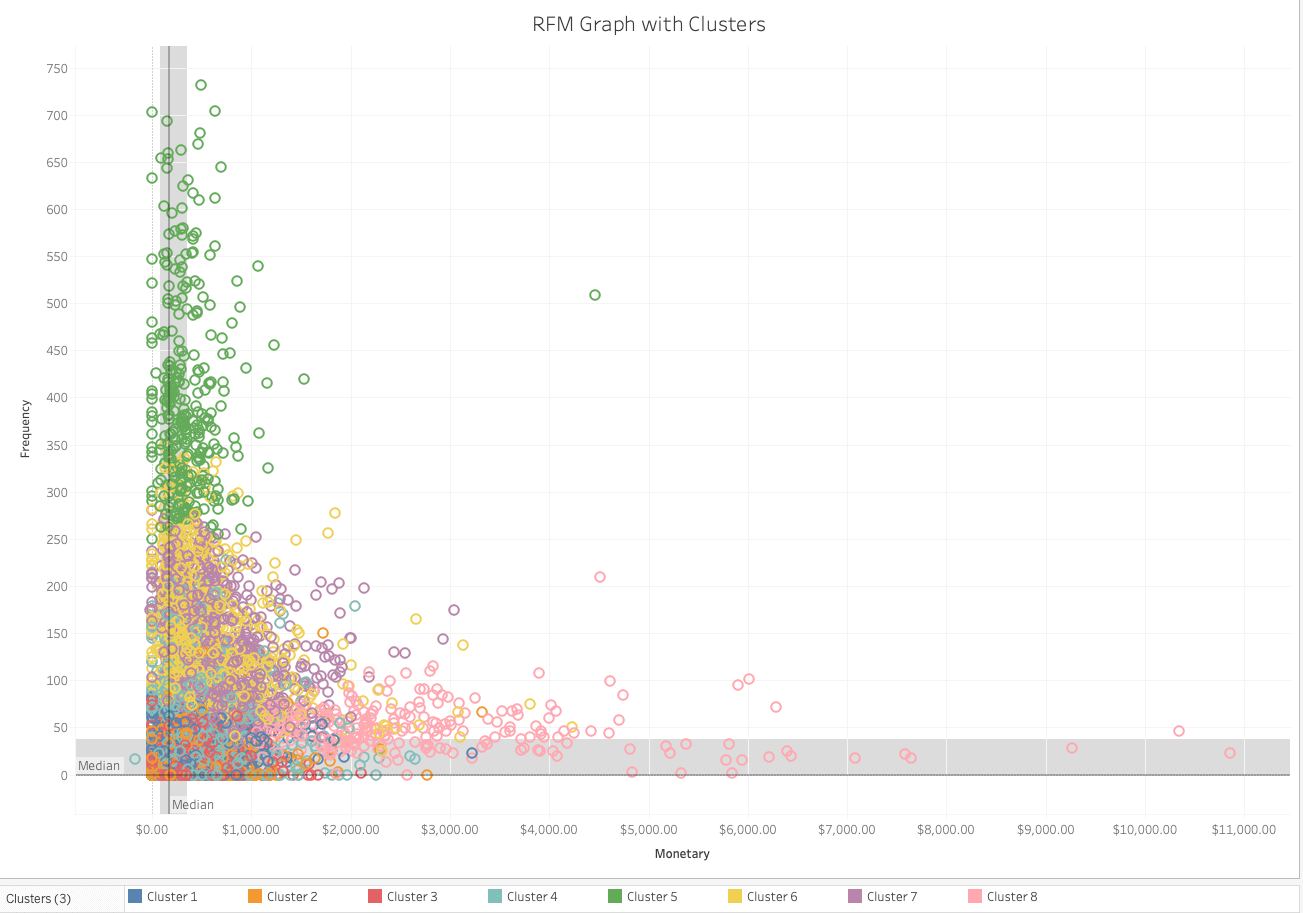
The graph below highlights the 8 resulting clusters, and maps the Frequency and Monetary for each consumer.
Background into the Retailer
Before we dive deeper into the analyses, let us provide some context into the company being examined. This retailer, based in New York, crafts women’s fashion apparel, and specializes in pants. Its sales hover around $200,000 in a typical month, and the brand sees a return rate of roughly 30%.
Identifying Your Key Customer Clusters and Moving Them Along the Buyer’s Journey
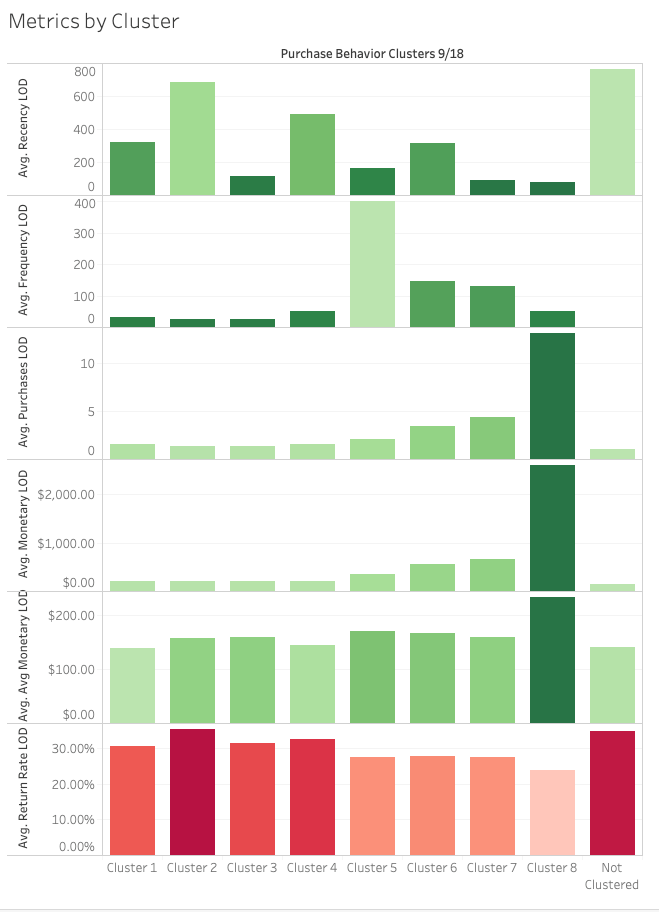
Think of the clusters as buyer personas. Each is characterized by its centers on RFM and related metrics, which in conjunction tell a narrative of that group’s typical purchase patterns.
This output, and others, allow us to describe the clusters on average.
We can use this information to optimize your ecommerce marketing strategy by identifying customer outcomes by their behaviors, anticipating the needs of the different clusters, and influencing customer behaviors to be more profitable.
This allows you to target the right person with the right message at the right time.
For example, if we observe a high-spending group that has not purchased recently on average, we can prioritize this group for messaging, content and promotions in order to regain their valuable activity.
Another example would be a cluster that has made few purchases, but has purchased recently. They would be a great case for more educational content to help develop their relationship with the brand and learn about its offerings.
The Brand Champions:
Take care of these people. They’re 3% of your customer base and represent 20% of your revenue
Cluster 8 represents the champions for this brand. These customers have bought recently, buy frequently, and have spent a great deal. This group’s return rate happens to be the lowest of any of the clusters.
The Cherry Blossoms:
They don’t come around often, but when they do they are beautiful!
Cluster 5 exhibits a somewhat orbital behavior: these individuals buy very infrequently (with an average of over a year in between purchases), but they spend a fair amount per order when they do buy. They’re loyal over time and remember who you are. While not the most valuable of customers, it is important to at least maintain this cyclical behavior.
The Up and Comers:
They’re almost brand champions, so make them feel special.
The individuals in Cluster 6, who are “next in line” to be brand champions or MVPs, are characterized by the second highest number of purchases on average, second highest average monetary value, and the second best recency on average.
They also have one of the lowest average return rates of any cluster. This all means that they may not have spent quite as much as the brand champions of Cluster 7 yet, but they are on track to be immensely valuable customers if their behavior continues.
The “Don’t Let Them Go!” Crew:
They have spent a lot of money in the past, but have been silent recently.
Cluster 6 represents consumers that this company should work very hard to retain. The customers in this group have spent a good deal of money with the company thus far but have not purchased recently, on average. These individuals have proven to be valuable customers, so a small investment to win them back may pay great dividends.
The Dead and Goners:
They made purchase, but brand friction has likely caused them to churn.
And Cluster 2 is composed of consumers who are mostly likely already gone; they have not purchased in over two years on average and returned 35% of what they did buy. And though it may be too late to regain these individuals, it is vital to learn from their experiences to be able to identify customers that may be slipping.
How RFM Analysis and Behavior Segmentation Can Pour Jet Fuel on Your Ecommerce Marketing Strategy
In the ideal state, we can use characteristic metrics of each cluster to anticipate the needs and behaviors of individual customers early in their relationship with a brand. This allows us to tailor touch points and influence consumer patterns to be more optimal for the company.
Here at ReturnLogic, we aim to clarify Customer Lifetime Value (CLV or LTV). Though it may be the pinnacle metric for the value of a customer, it can be a complex lagging metric with regards to implementation.
(Free Resource: If you’d like a handy tool for calculating the historical CLV of your customer base using RMF analysis, check out this free CLV calculator.)
In other words, it is a good metric to consider, but a bad one to chase.
It conveys the expected value of a consumer but does not itself carry the same actionable insights that does RFM Analysis. For this reason, we also examine the transaction behavior of customers, which will eventually culminate to their monetary value.
In particular, we’re very interested in tracking customers through their lifecycle with a retailer – understanding how their purchase patterns and return behaviors may change, and then using this information to optimize profit.
The lifecycle can be looked at in terms of time, or sequence of orders.
To our team, order sequence involves ordering a customer’s purchases with a brand, effectively examining the customer lifetime as a sequence of purchases, from 1 to n.
This perspective allows us to see any changes in behavior across purchases, identifying what may be points of struggle for consumers in their experience with a company.
Below, you can see the average number of days between each purchase in the sequence for this retailer.
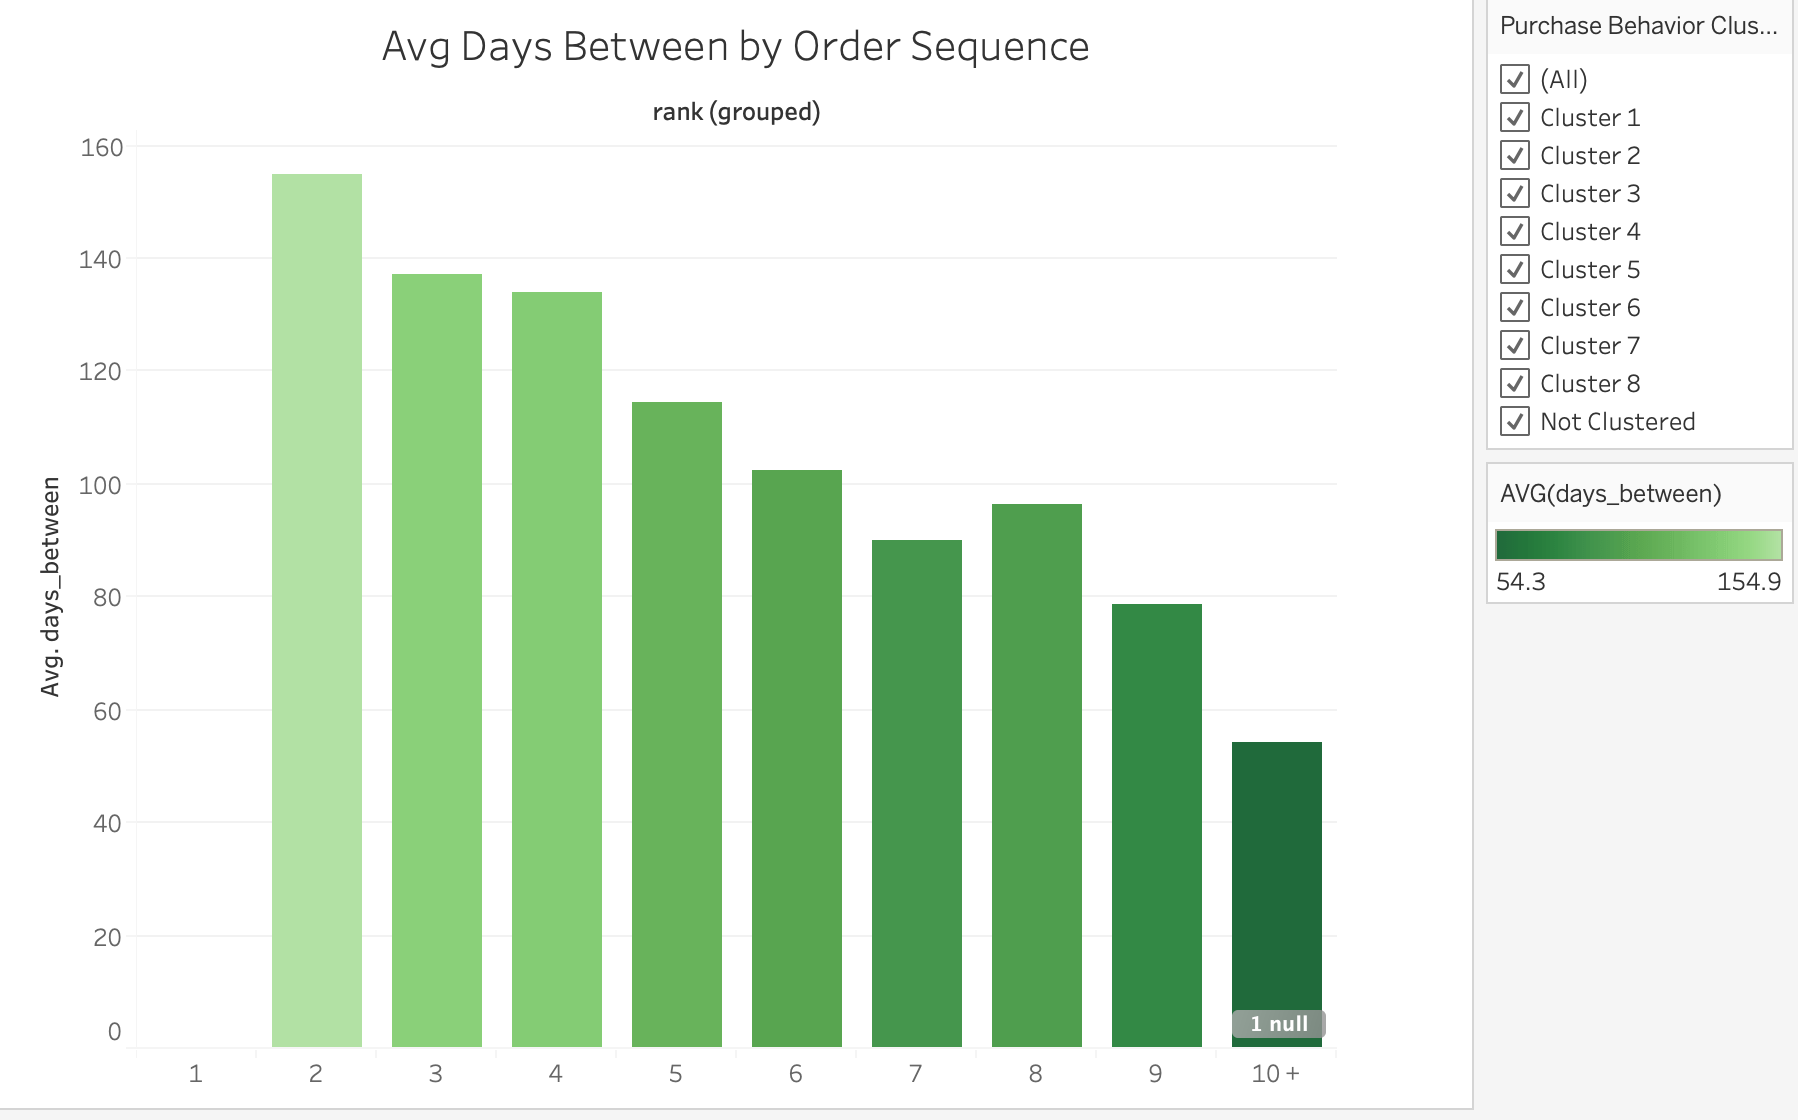
For instance, nearly 160 days transpire on average between a customer’s first and second purchases.
We see that the overall trend is downward: this indicates that as a customer is deeper in their relationship with the company (defined by number of purchases thus far), the average number of days between purchases decreases.
Knowing the average days between each order can inform customer retargeting, helping retailers to more precisely message to customers when they may be ready to purchase again.
This view becomes all the more telling when it is sectioned by customer cluster.
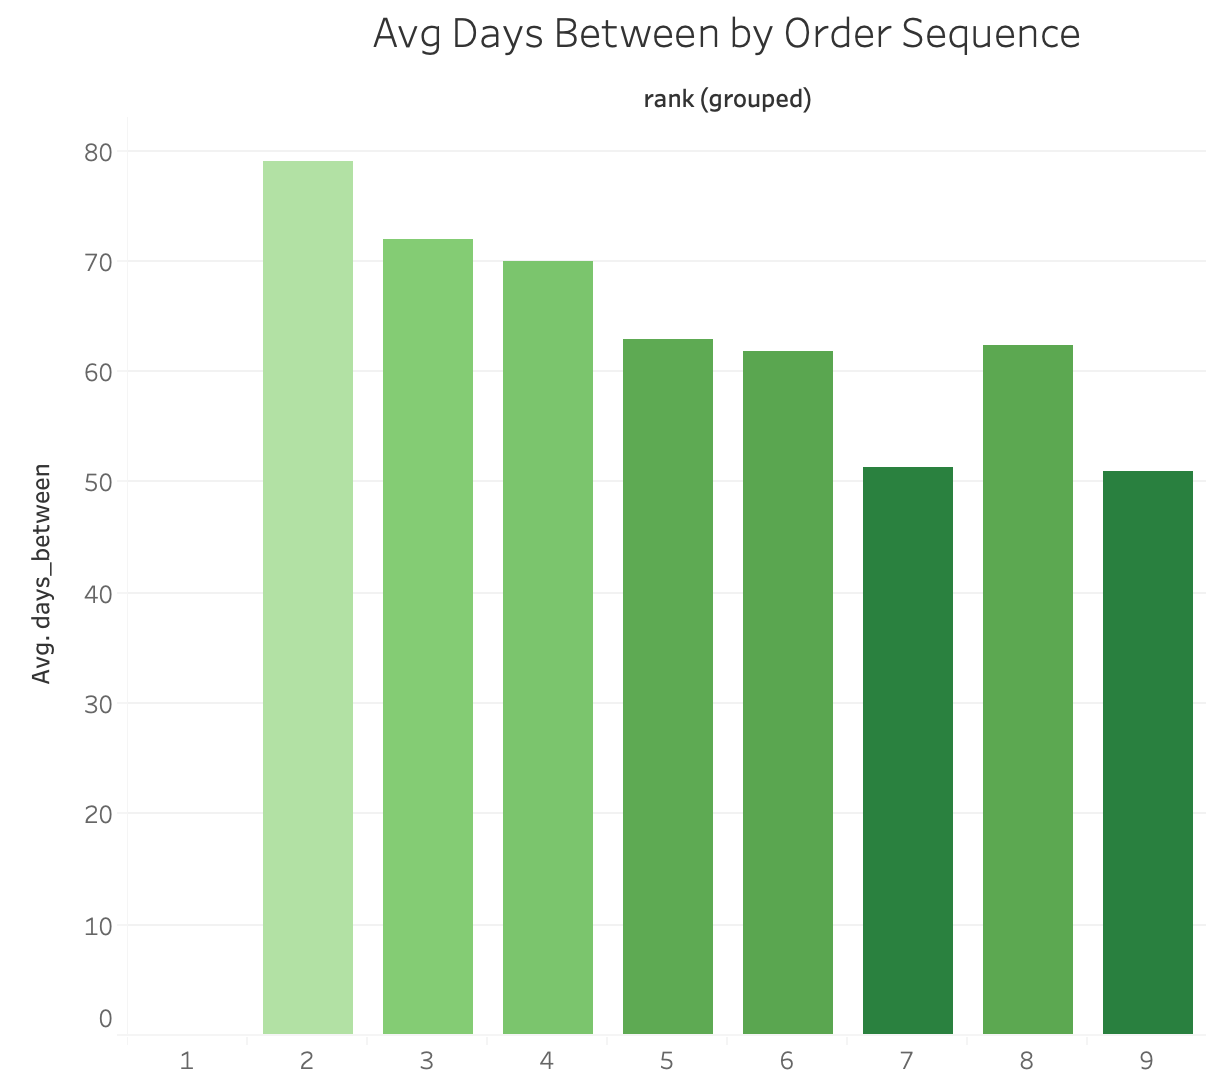
Cluster 8, the brand champions, exhibit a similar overall trend, but beginning at about half the amount of time.
The average days between the first and second purchases for this group is right about 80. And, as expected, the average number of days between purchases tends to decrease as the sequence of order increases.
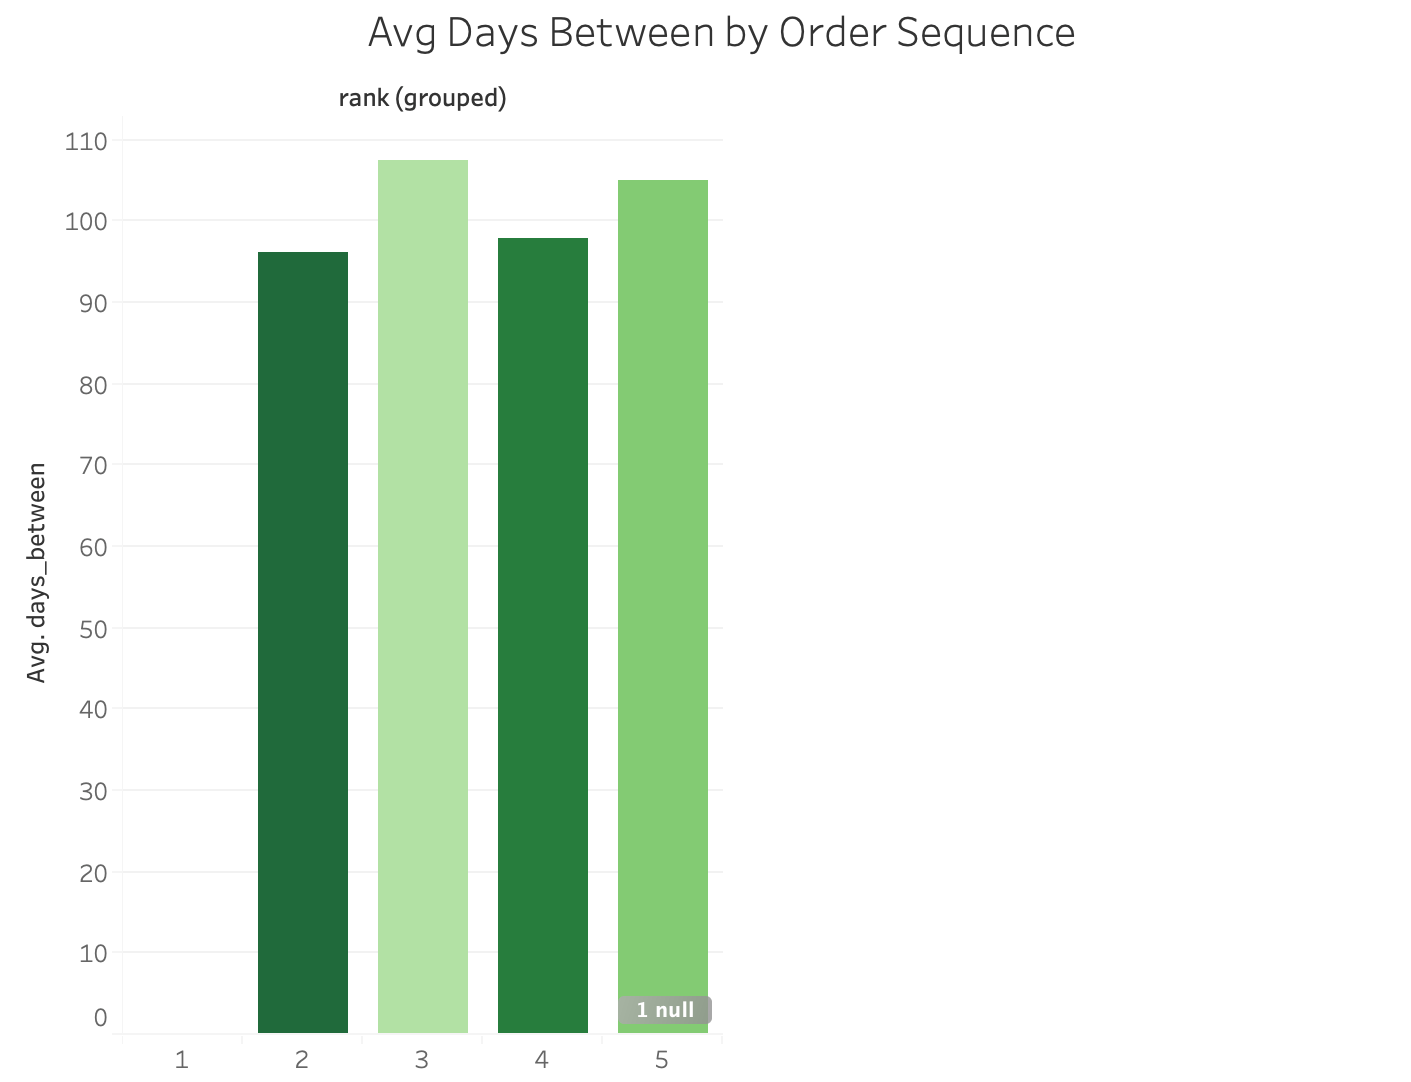
To complicate the observations above, a similar threshold is seen for those in Cluster 2, the customers who are more than likely gone.
Just like those in Cluster 8, these individuals made their second purchase relatively soon after their first purchase, on average. However, customers in Cluster 2 never reached 6 purchases.
This tells us that days between purchases by itself may not be able to determine your best customers from those who are liable to leave, from the first few purchases.
But as we dig deeper into the date we find the real golden nuggets.
Returns Data Key to Spotting High-Performing Customers Early
Customer segmentation helps you identify high-performing customers early, which enables you to double down on your efforts to engage and retain them.
And by recognizing the behavior of susceptible customers, you can attempt to intervene and save the customer relationship before it is too late.
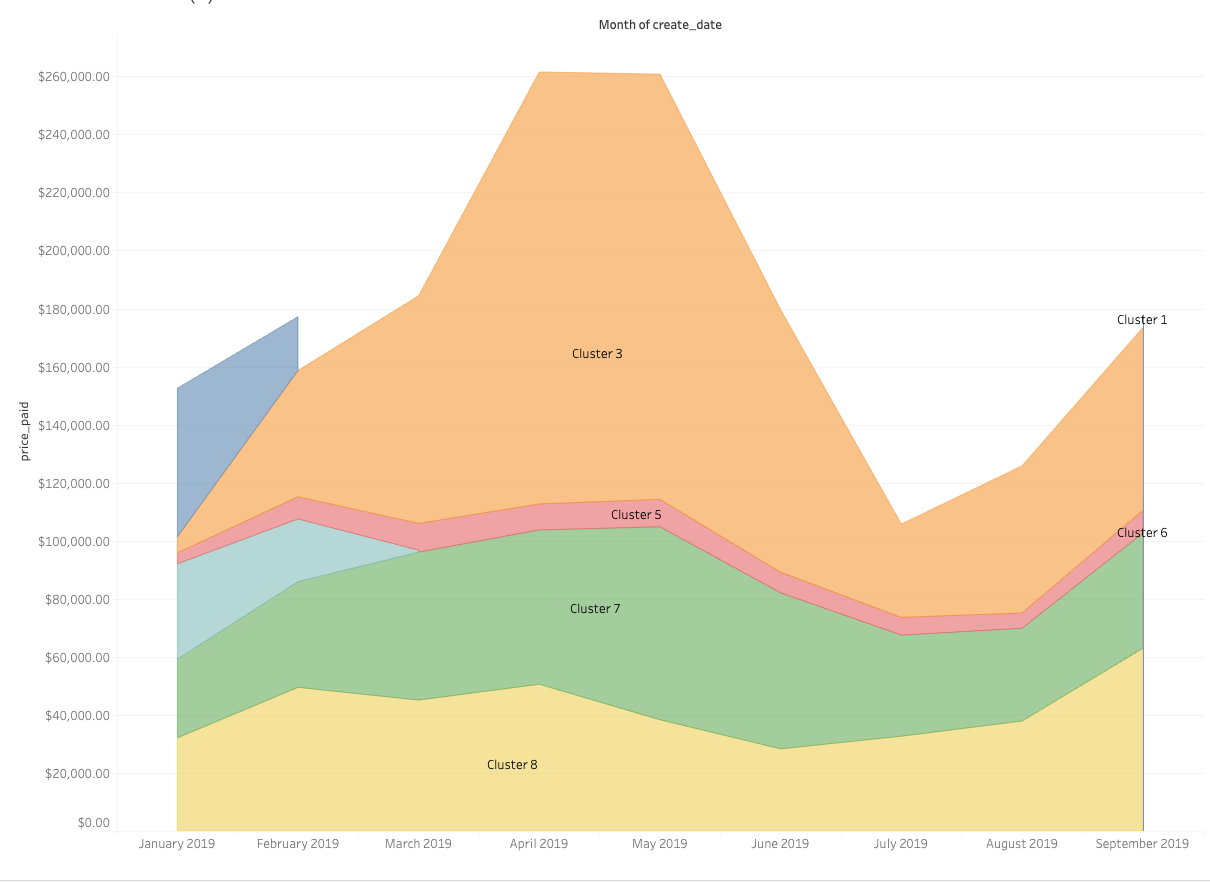
In the graph below, the yellow stripe along the bottom shows the monetary impact of the Brand Champions. Though they make up about 3% of the customers included in the analysis, these buyers consistently account for about 20% of the overall spend.
So, the seven million-dollar question:
“What are early indicators of ideal versus susceptible customers?”
Intuition could suggest the value of the first several orders may be informative.
Those who spend increasingly more early on in their relationship with the brand are those who will stay around and continue to spend. But this rationale falls short, as we will observe.
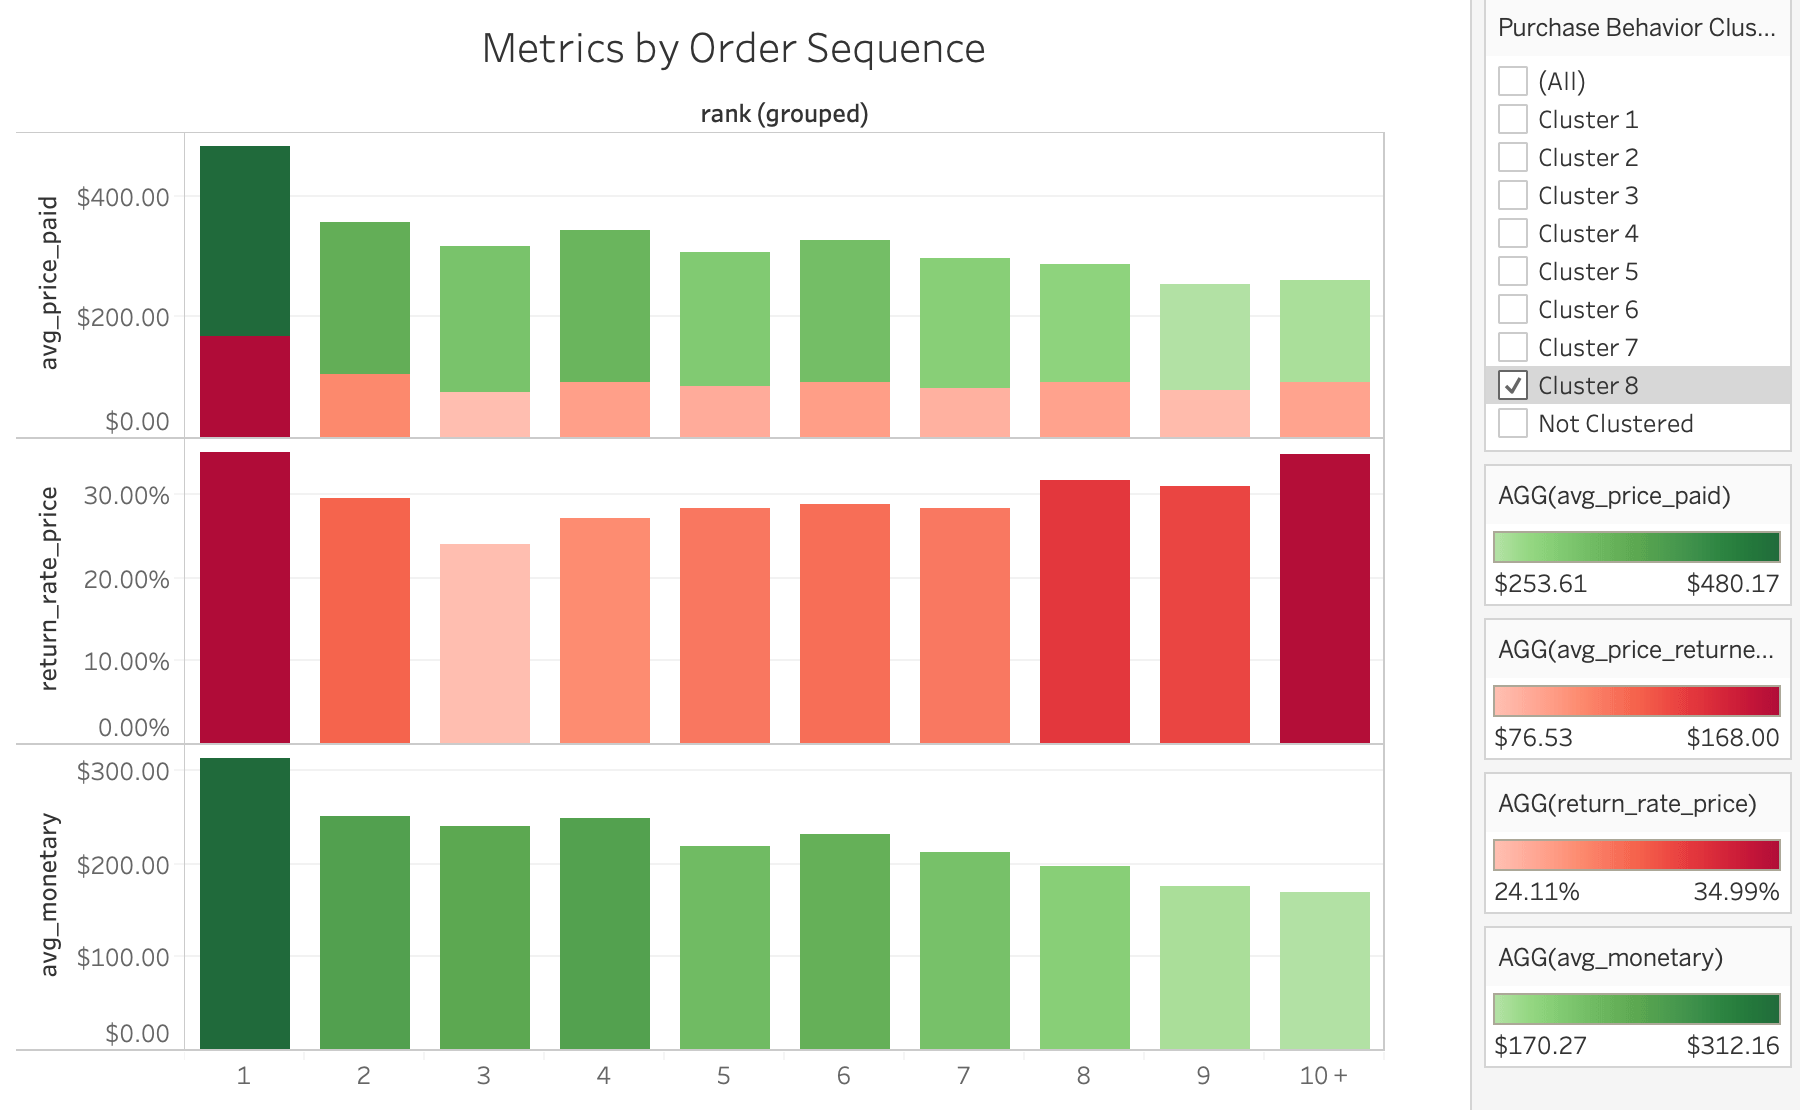
The brand heroes of Cluster 8 do not, in fact, tend to spend more throughout their purchase sequence. They actually tend to spend less on average. However, the average value that these consumers return also drops in the first several orders.
And though the money the brand retains per order on average is never nearly as high as in the first purchase for this cluster, the reduced return rate after the initial purchase is indicative of a positive customer experience which will drive a healthy customer relationship.
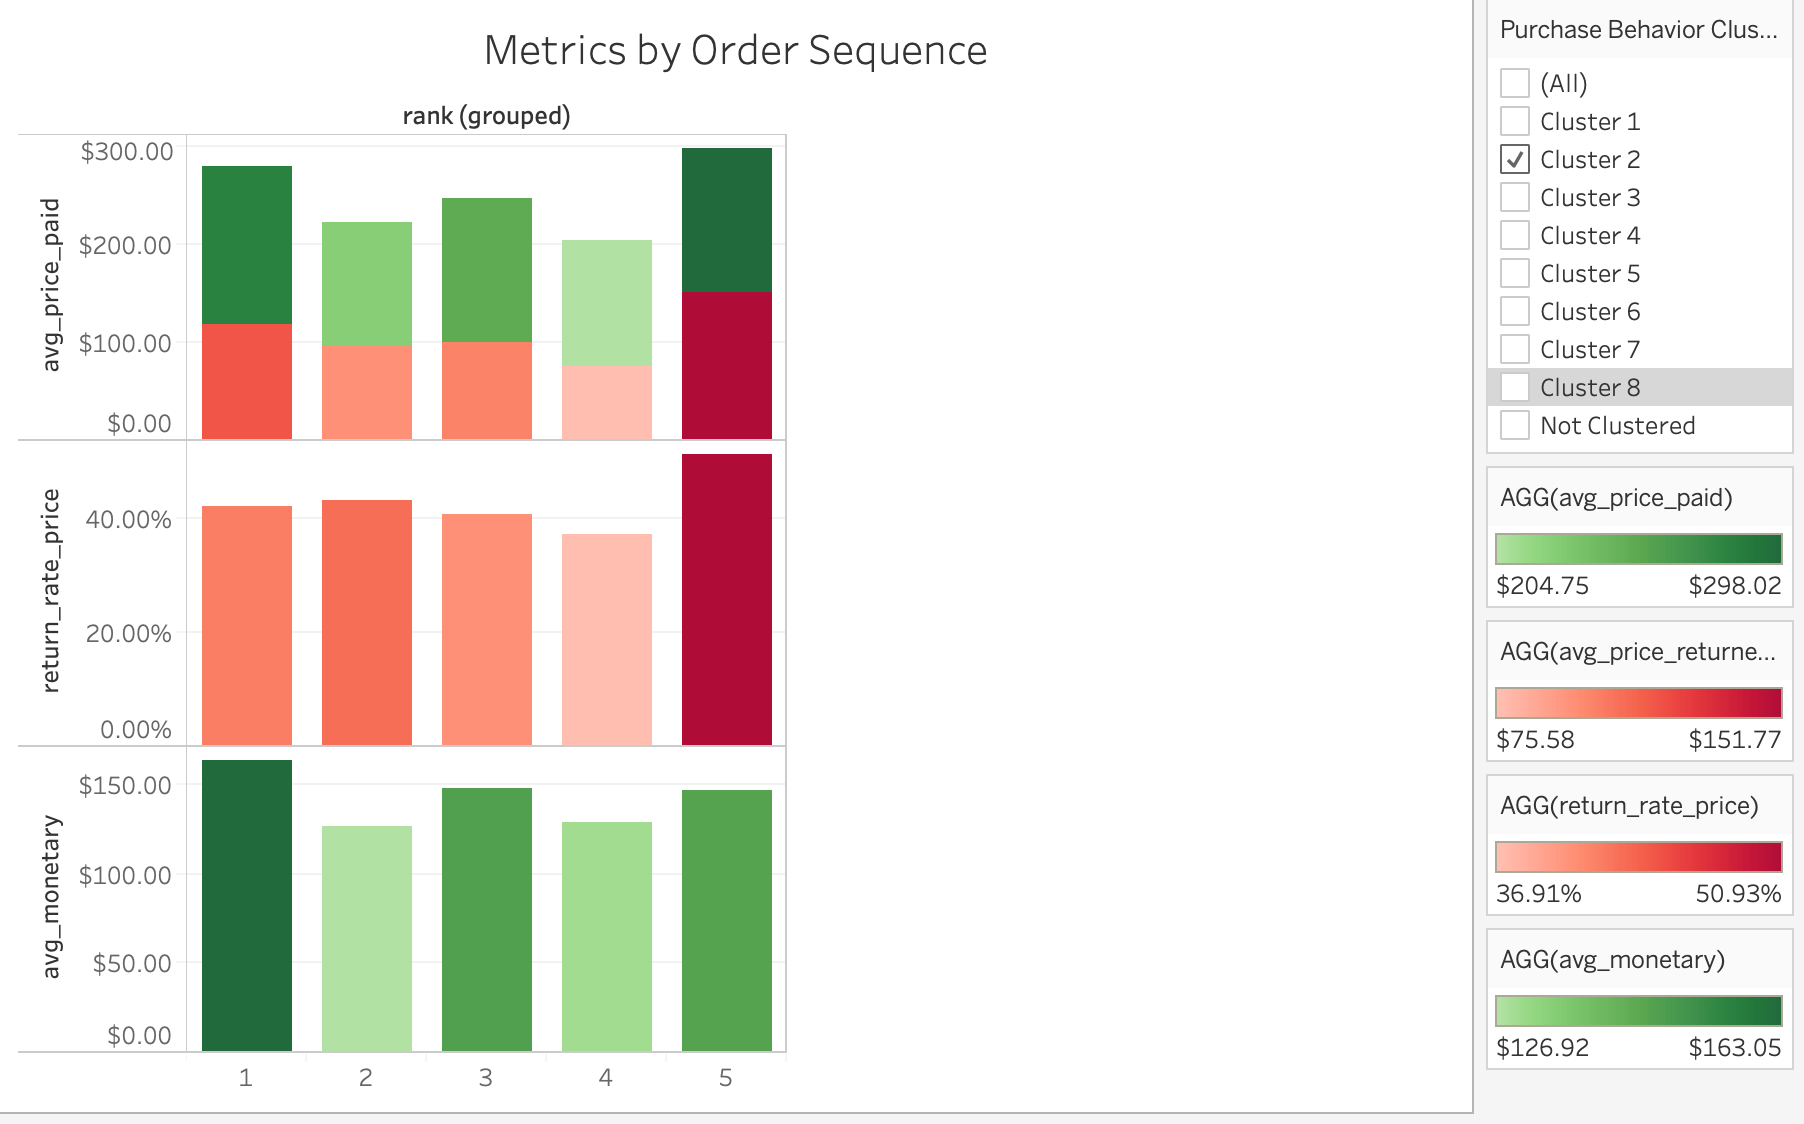
Meanwhile, the susceptible customers of Cluster 2 did not quite see this drop in spend throughout their first few orders. Using sales value alone to identify top customers may be more harmful than helpful for this retailer. Furthermore, return rate stayed roughly stagnant in these purchases.
In the fifth order, the average spend even exceeds that of the initial purchase but is offset by a return rate of 50%. And none of the customers in this group reached a sixth purchase – it seems that this event signals the likely end of the customer’s relationship with the brand.
Return rate could well be an early indicator of the long-term value of a customer.
Turning Returns Management Insight into an Actionable Ecommerce Marketing Strategy
Test #1: Engage The “Don’t Let Them Go!” Crew with a Reengagement Email Campaign
Craft an email campaign to bring these customers back to your website and encourage them make another purchase so they reengage with the brand.
Sam Crawley, a product data scientist for DotDigital says: “This represents a great opportunity to increase your loyal customer base.“
Using coupons or other incentives as leverage for this cluster will help you maximize the investment over time since they’re more likely to stay engaged if they come back and purchase.
Test #2: Find More People Who Look Like Your “Brand Champions”
Pull your list of Brand Champions once per quarter and upload it to Facebook. Build a lookalike audience based on these people and let Facebook find people who match them. Use this audience to test new customer acquisition campaigns and track the progress against your traditional audience building methods.
Test #3: Deliver an Over the Moon Experience to Your “Up and Comers”
Give these people the nudge they need to totally fall in love with your brand. Send them early release products to sample. Invite them to your VIP events. The key to maintaining and achieving this full potential most likely lies in creating extra value, making them feel special.
Test #4: Launch a Referral Program to Your “Cherry Blossoms”
These people know your brand well and have stayed loyal over time. For some reason they just don’t purchase very often. Keep them engaged and give them an incentive to share that good will with their friends and family by offering them to take part in your referral program.
How You Can Implement This for Your Ecommerce Store
In addition to automating the returns process, and aiding in returns optimization, ReturnLogic is on a mission to giving the power back to retailers.
To the Data & Analytics team, this means leveraging data collected through the purchase and returns process to distill actionable insights that unlock greater profits.
Customer segmentation identifies specific clusters of customers, and their associated behaviors, which can help retailers more precisely connect with their consumers. We can recognize characteristic behaviors and use the metrics of these clusters to better meet their needs and drive more optimal behaviors.
The insights and resulting strategies are bound to differ across clients, but this framework enables us to work with retailers to help them do what they do best.